Understanding Your Data: Metric Tiles (Property Overview)
Let's take a glance at the key statistics in your dashboard
Let's take a glance at the key statistics in your dashboard. You can select a date range or set a custom date range by hitting the date range button. In this example, we'll look at the last 7 days.
First up, We have our health score.
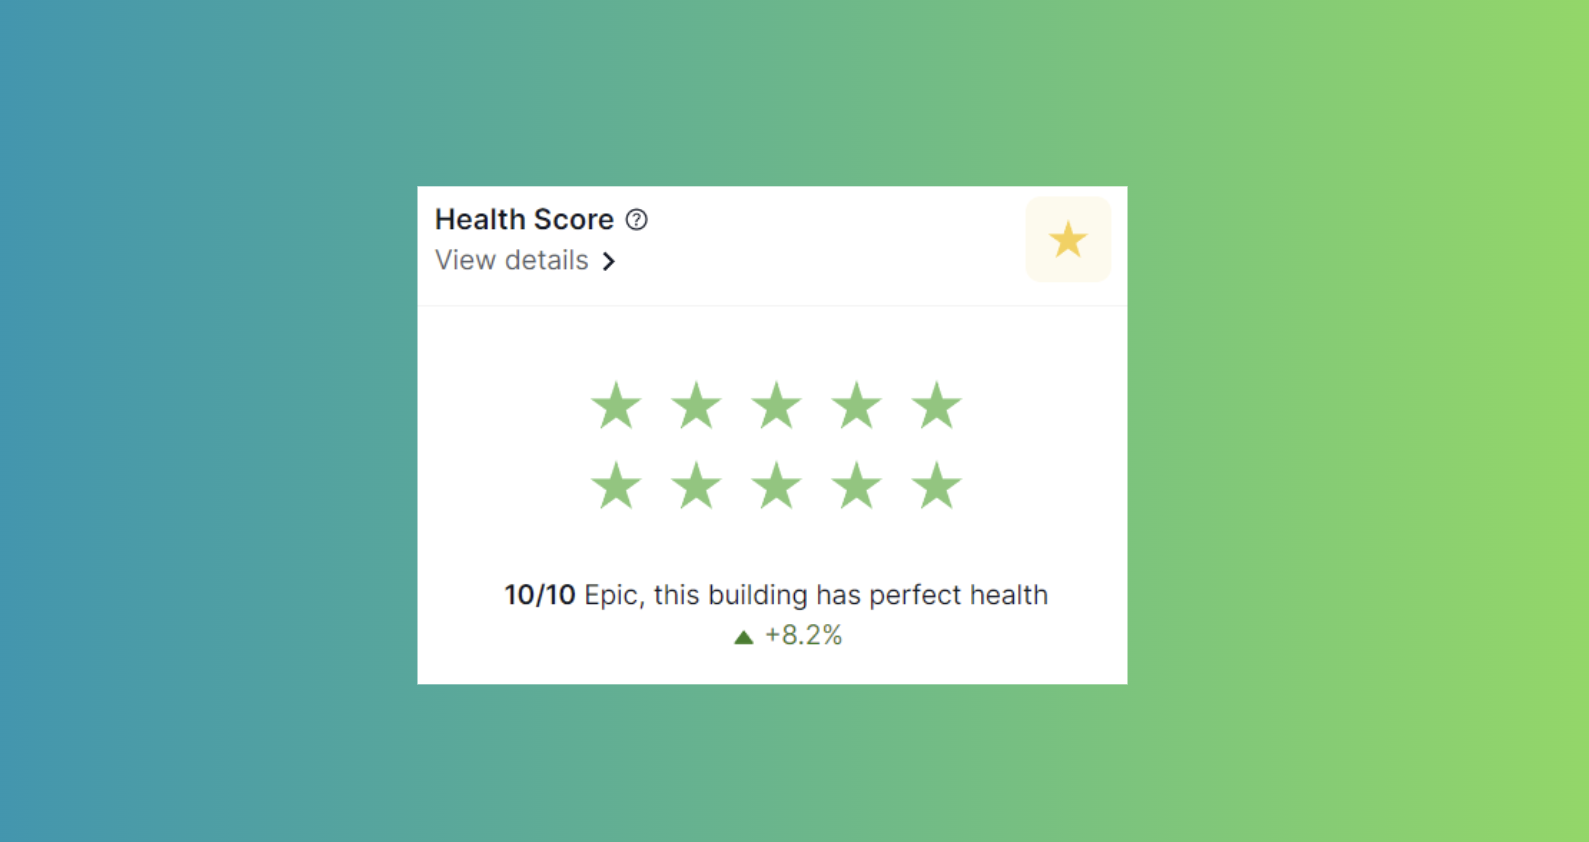
The Health Score is calculated by the percentage of time spent within the health ranges for temperature, relative humidity, and carbon dioxide during occupied times. We also factor in thermal comfort levels and mould risk.The Health Score is not only a great way to understand your buildings performance at a glance, but also enables you to benchmark overall performance from month to month, season to season and on an annual basis.
As you can see here some rooms are performing much better than others. In this example of 4/10 possible stars. This means there is a lot of room for improvement, and interventions can be made to improve this.
Next, we have our airborne index panel
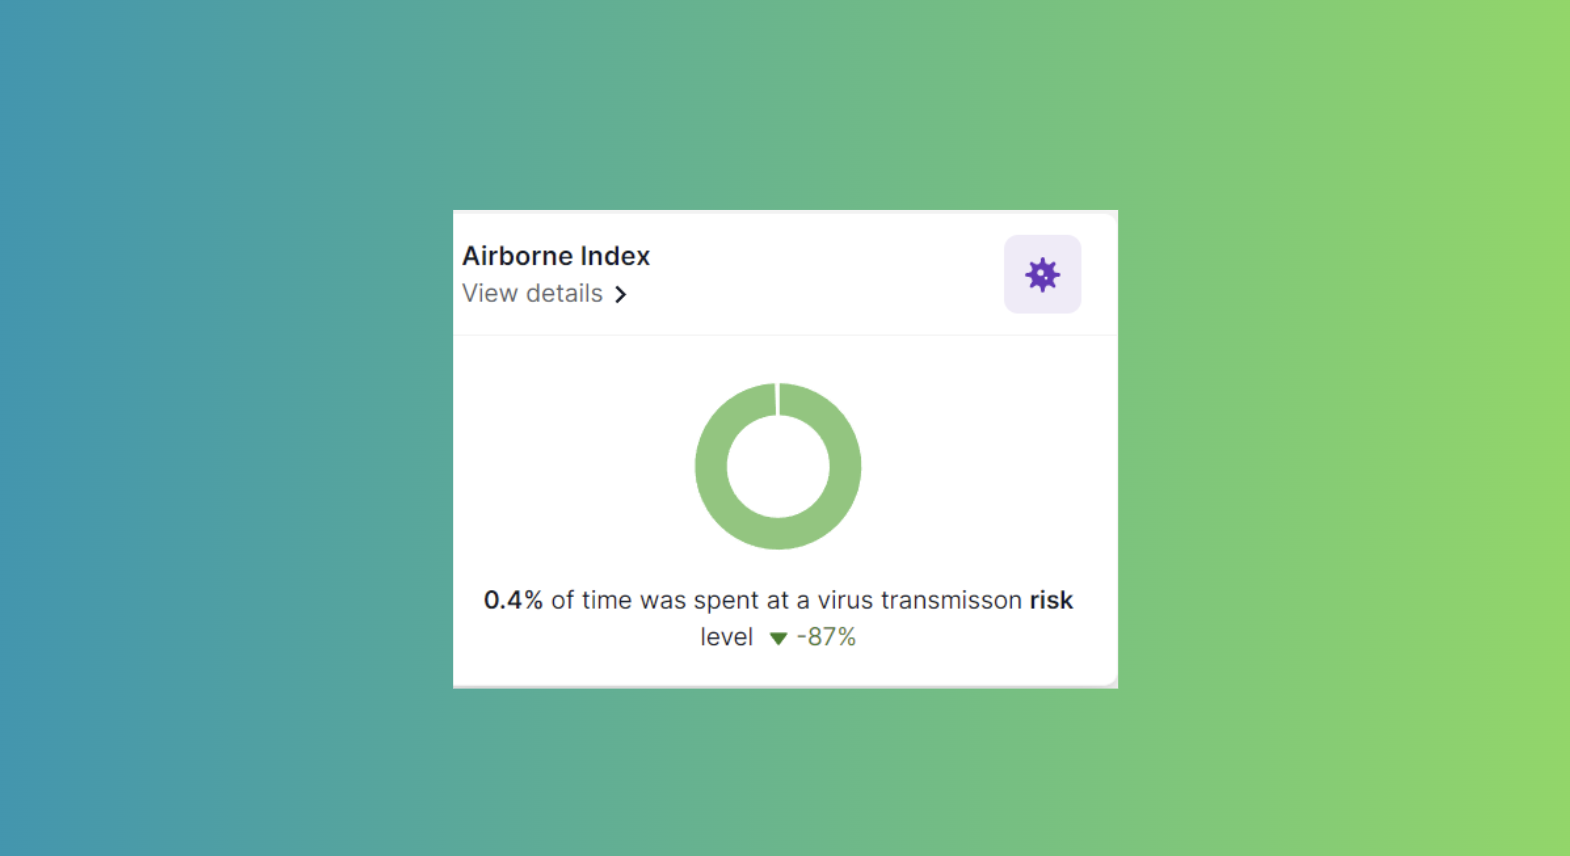
Airborne Index is Tether’s CO2 monitoring solution to manage airborne virus transmission risk. In a populated area, if the space is not sufficiently ventilated then the air you breathe will have a higher percentage of exhaled breath from other occupants which may contain viral particles.
Moving on to Focus Index
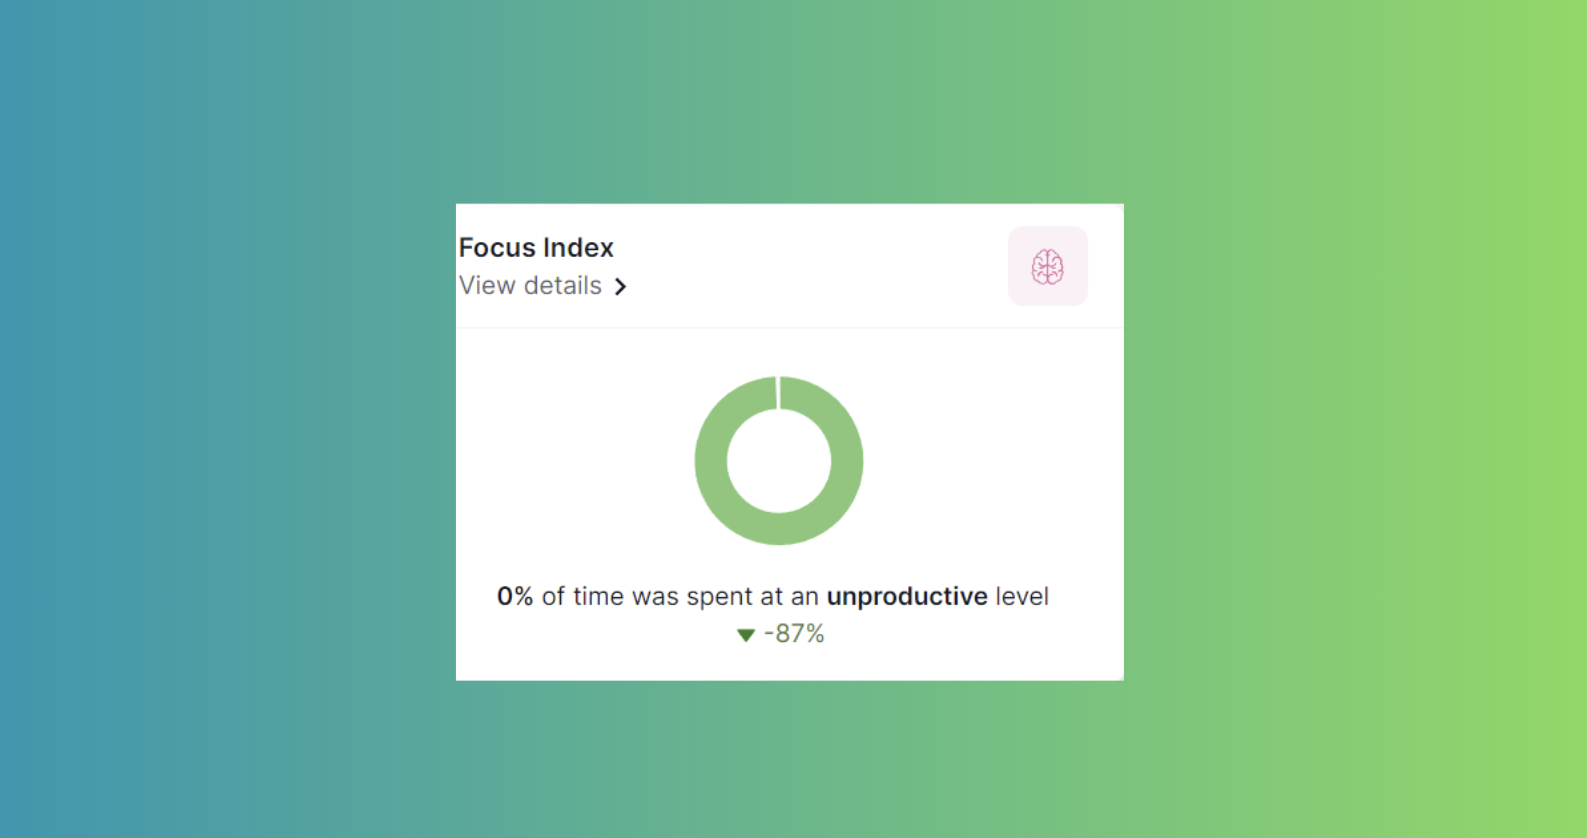
Similarly, this is determined by measuring the amount of CO2 in the air. Our research suggests that we lose marginal focus and productivity when the CO2 content in the air is above 1000ppm.
Next up we have Comfort Index
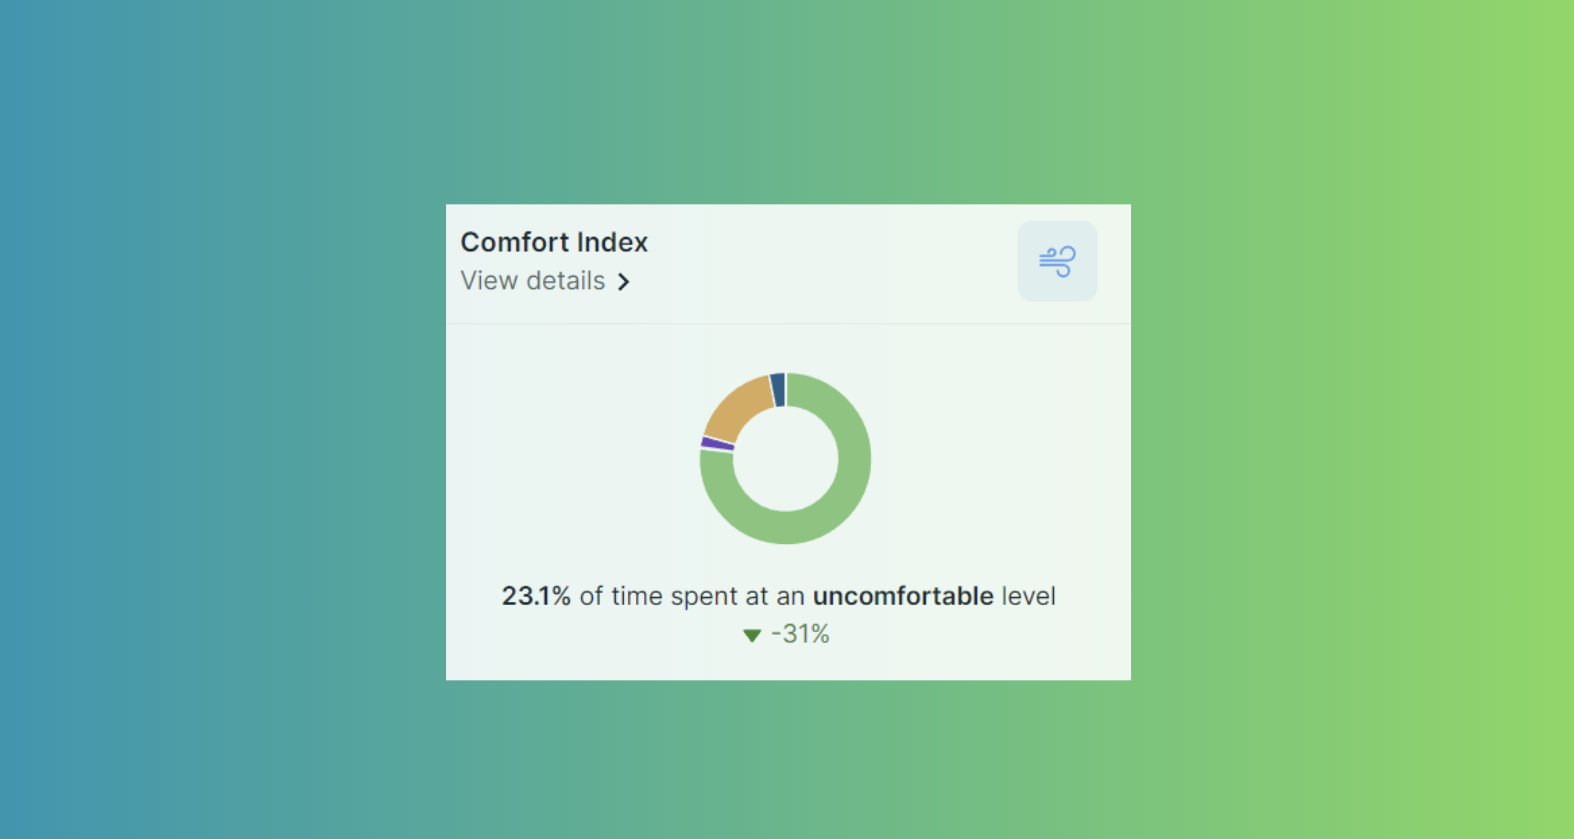
Our Comfort Index metric helps you keep track of how comfortable your spaces are for everyone inside. We use temperature and humidity as indicators of comfort because they can really affect how people feel. The Comfort Index not only helps you understand the comfort quality of the air, but it also has alerts to let you know when the air becomes uncomfortable, so you can take steps to make it comfortable again.
In this example the rooms are very cold. 100% of the time has been spent at an uncomfortable level. Interventions need to be made to increase the temperature in these spaces. A heat pump would be highly recommended.
Over here we have the Mould Index
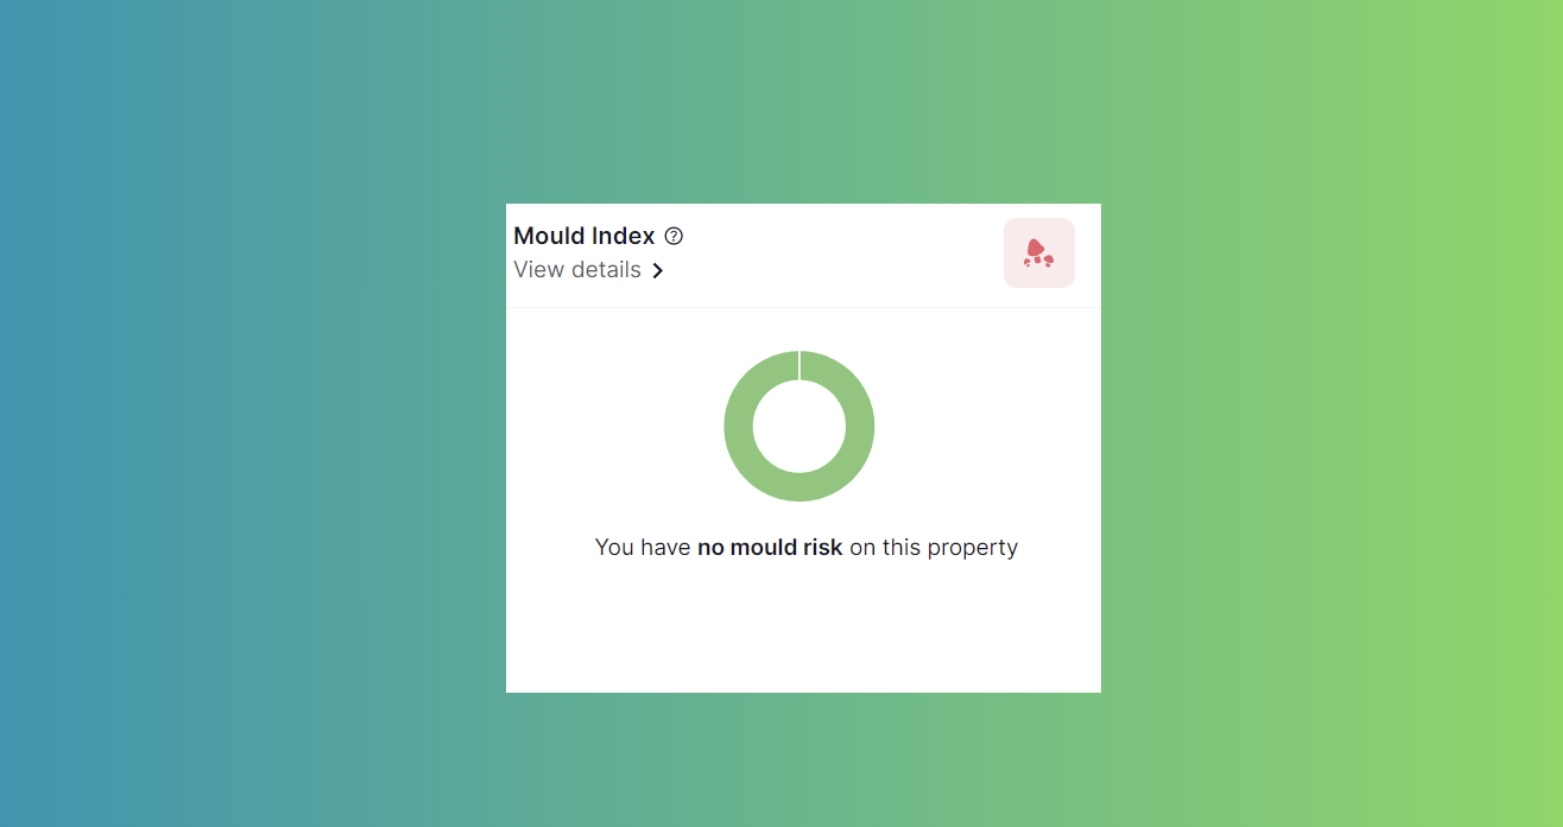
Our Mould Index metric helps you monitor the risk for mould growth in your spaces.
We use temperature, humidity, and time to track this risk. The longer that a building has high humidity levels and a suitable temperature, the greater the risk of mould growth becomes. The Mould Index not only helps you understand and track the risk levels of your spaces, but it also has alerts to let you know when the risk levels increase, so you can proactively identify and address any issues that may be causing mould growth, such as water leaks or high humidity, before they get worse.
Next up we have Carbon Impact
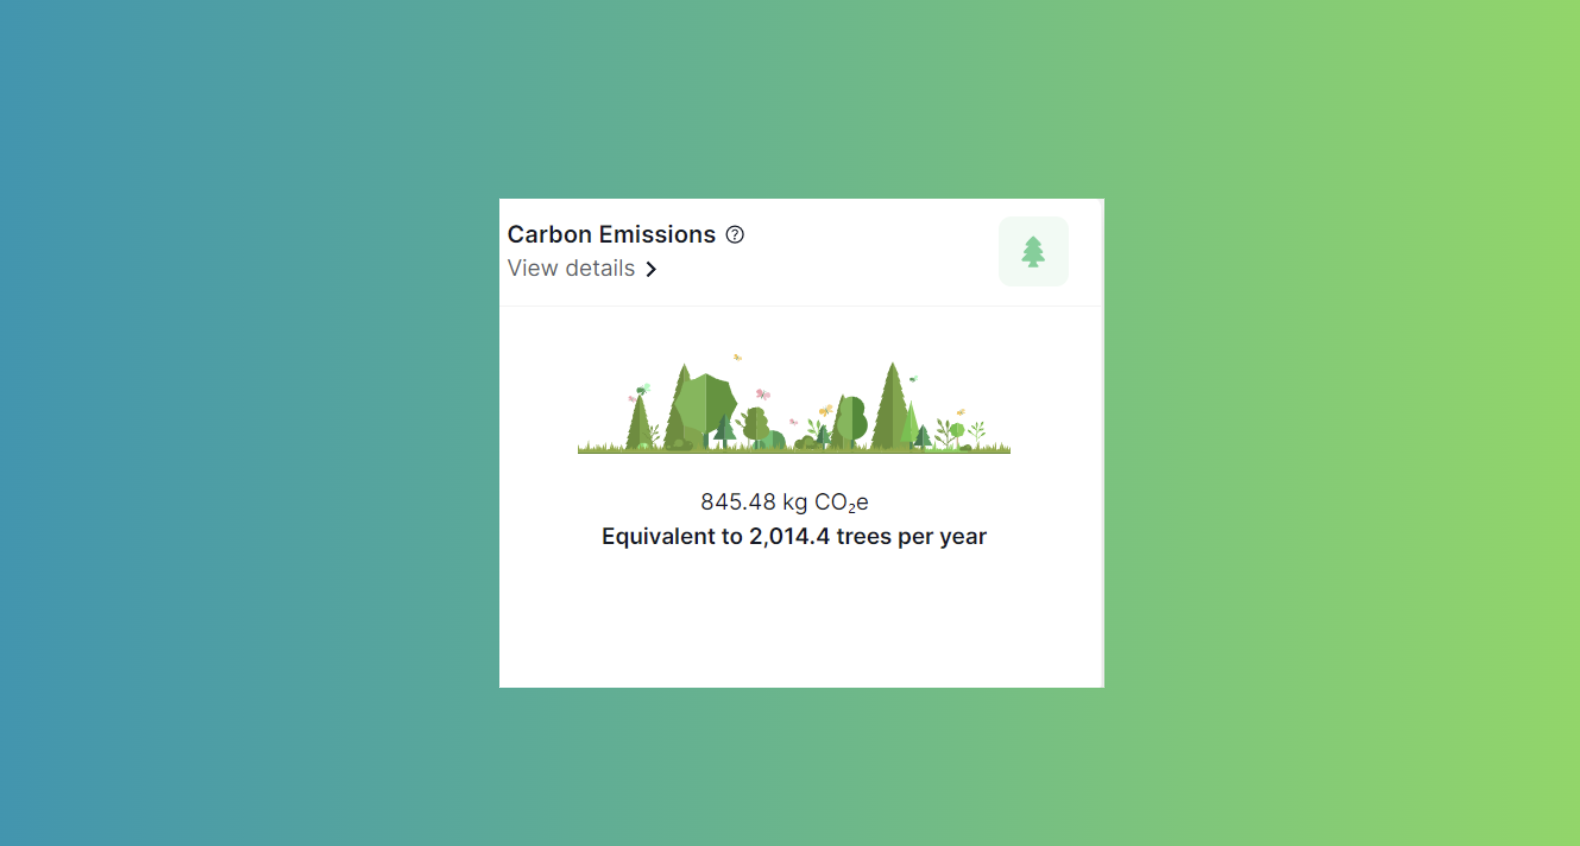
Our Carbon Impact metric is here to help you see how much operational carbon your building is using.
It’s an easy way for you to keep an eye on the carbon footprint of your building, and find ways to reduce it. We’ve tried to re-contextualize this information to make it a little easier to understand. As you can see here we have a handy little Tree-calculator which can be a little easier to visualise than a string of numbers. In this example you can see we’ve used the equivalent carbon of 253.3 Trees in the last 30 days.
Alright, here is Energy Use Intensity
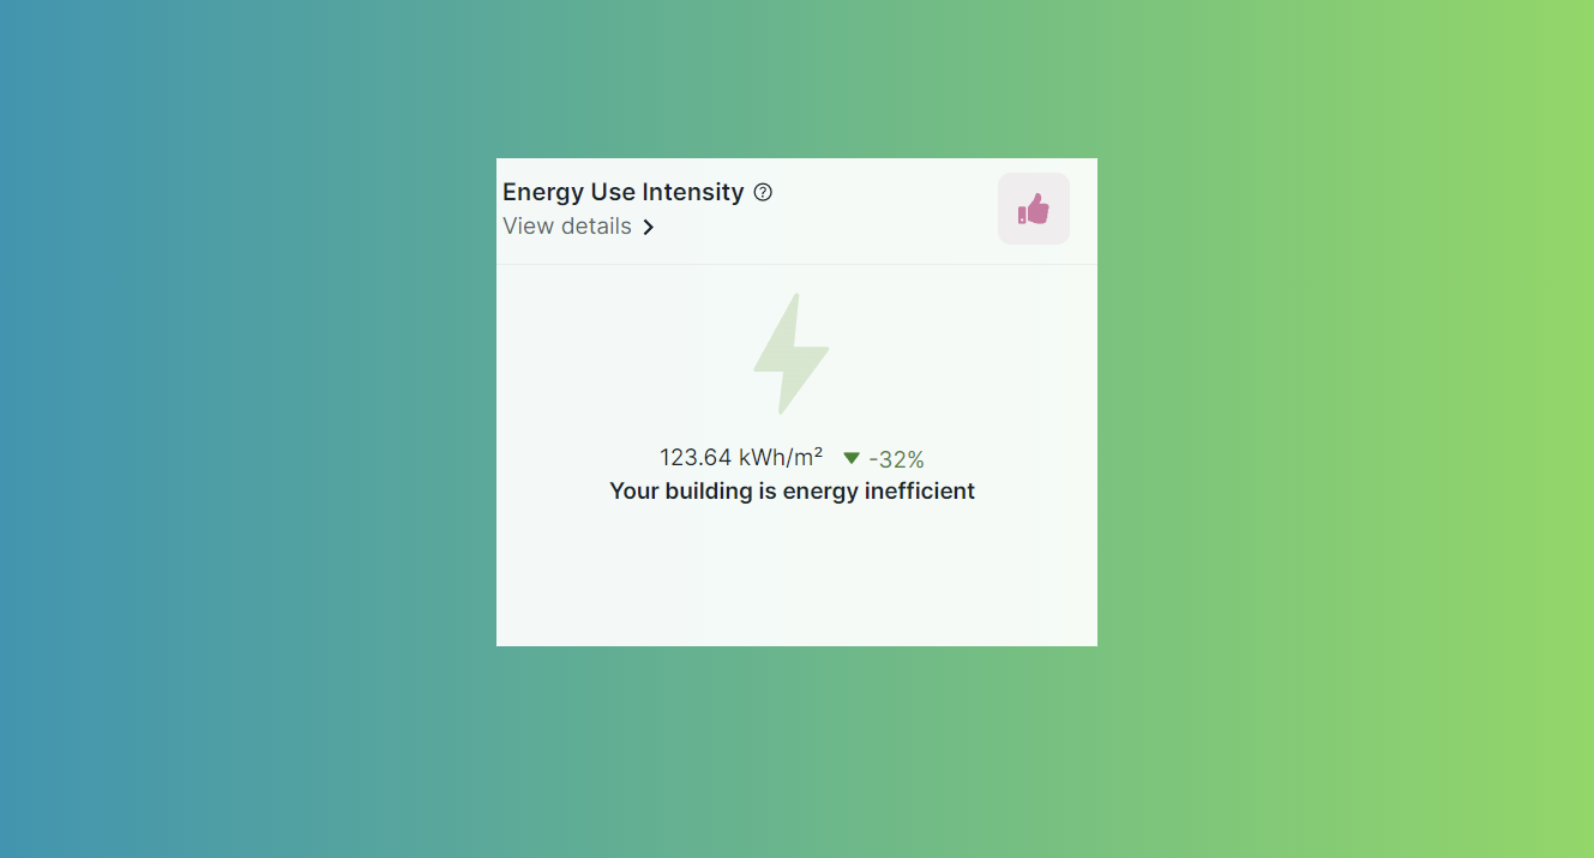
Our Energy Use Intensity metric, or EUI for short, helps you see how energy efficient your building is in comparison to other buildings of the same type/functions Generally, a low EUI signifies good energy performance. However, certain property types will always use more energy than others. EUI is an industry recognised metric for benchmarking energy performance across various building types and functions.
Next, we have Energy Usage
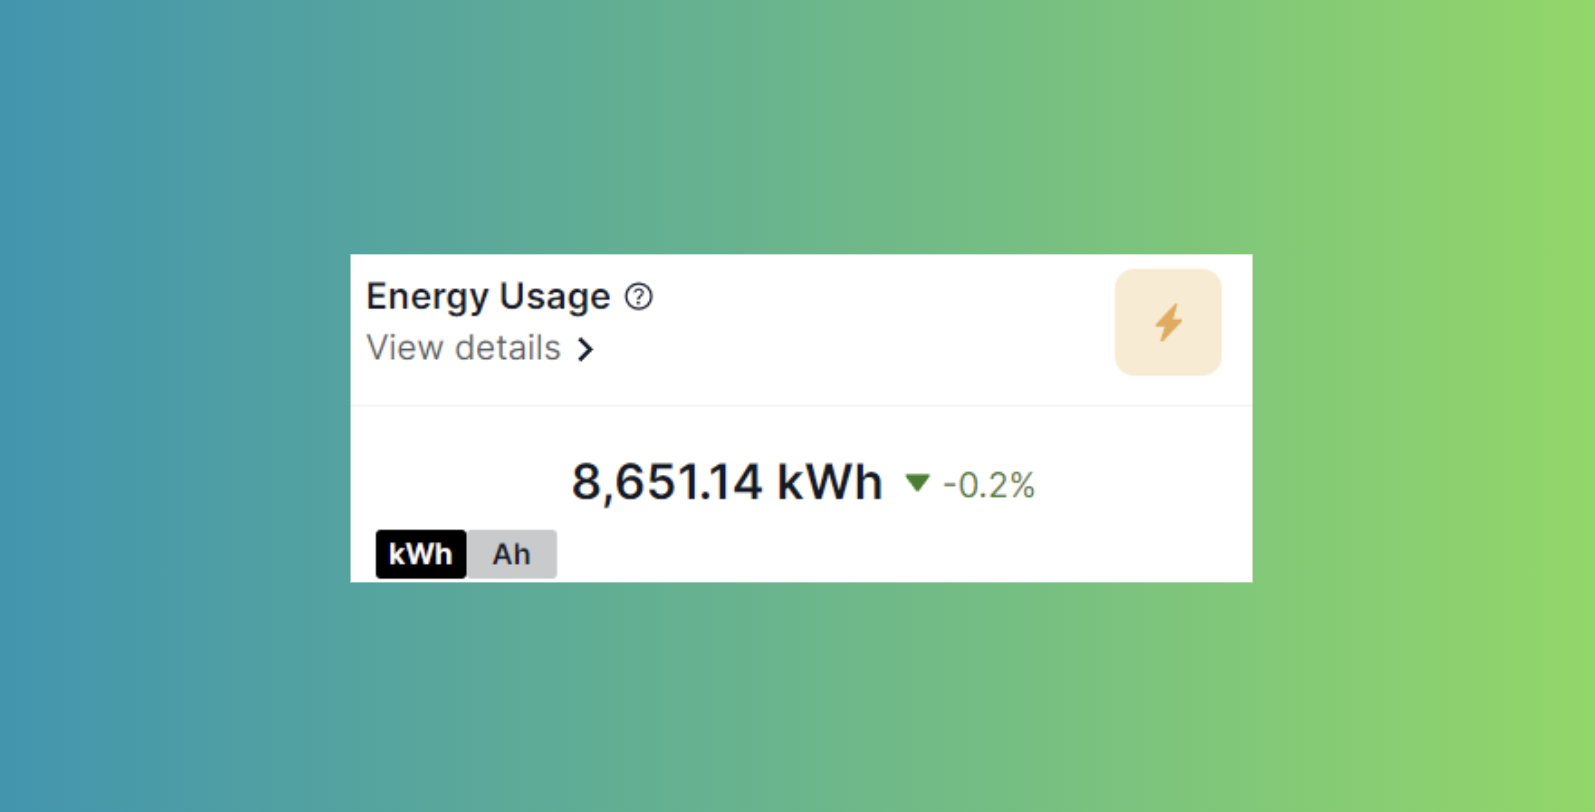
Energy usage is the total amount of energy used in the selected time period measured in Kilowatt hours. You can toggle between Kilowatt hours and Amps here.
Moving on to Energy Cost
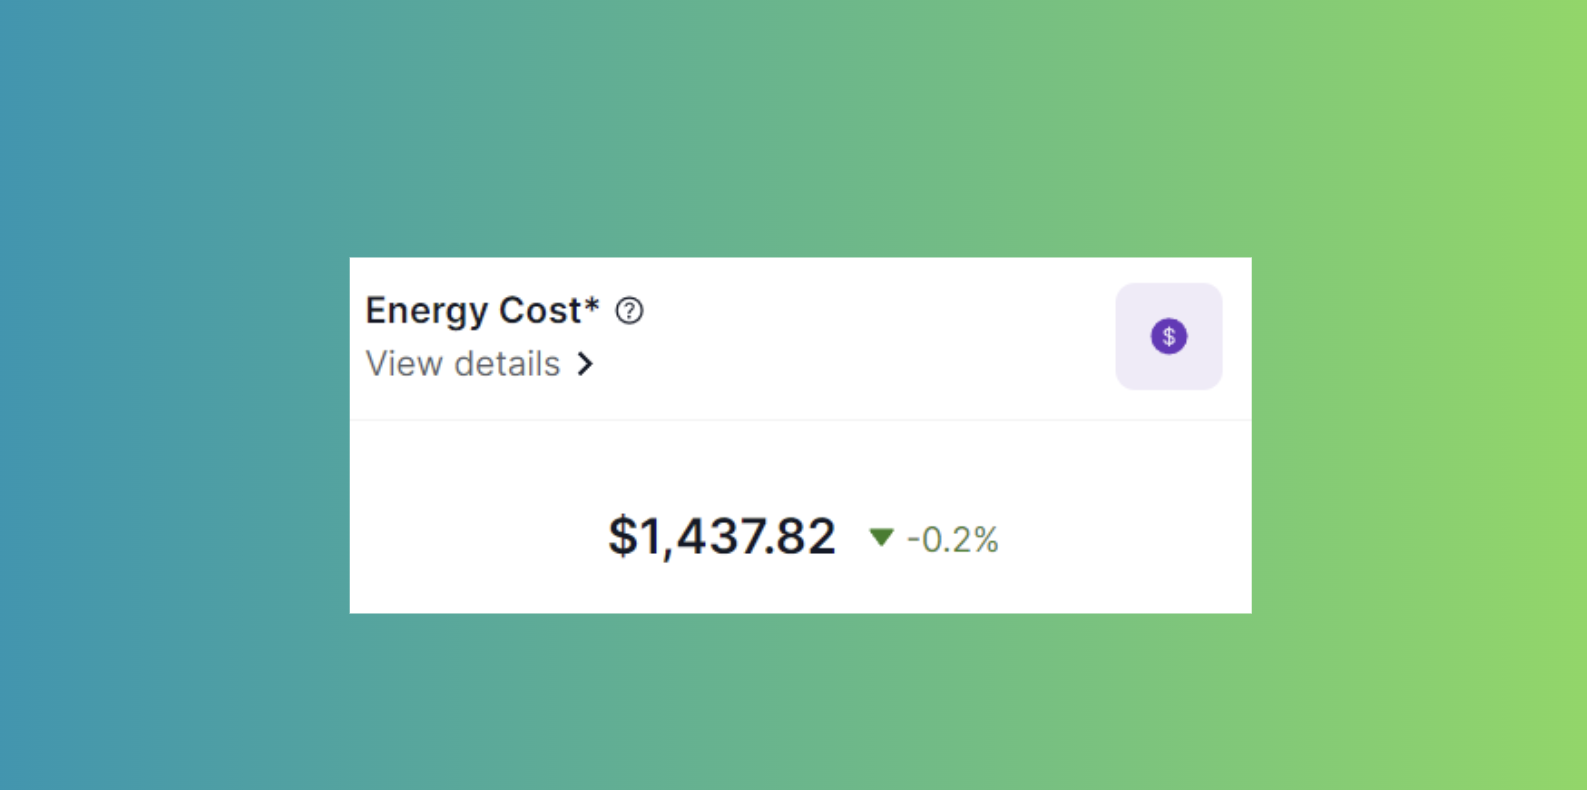
This is the total estimated energy cost for the selected time period based on the average power cost in your country.
Thanks for choosing Tether
![Tether Primary Logo-01-1.png]](https://partners.tetherhq.com/hs-fs/hubfs/Tether%20Primary%20Logo-01-1.png?height=50&name=Tether%20Primary%20Logo-01-1.png)