Generating Reports & Downloading Data to CSV
Want to keep tabs on your property's performance each month, but short on time to sift through all the data? Our monthly reports at Tether are just the solution you need!
Tethers monthly reports are packed with insights and updates about your property's performance. Let's dive into the details together!
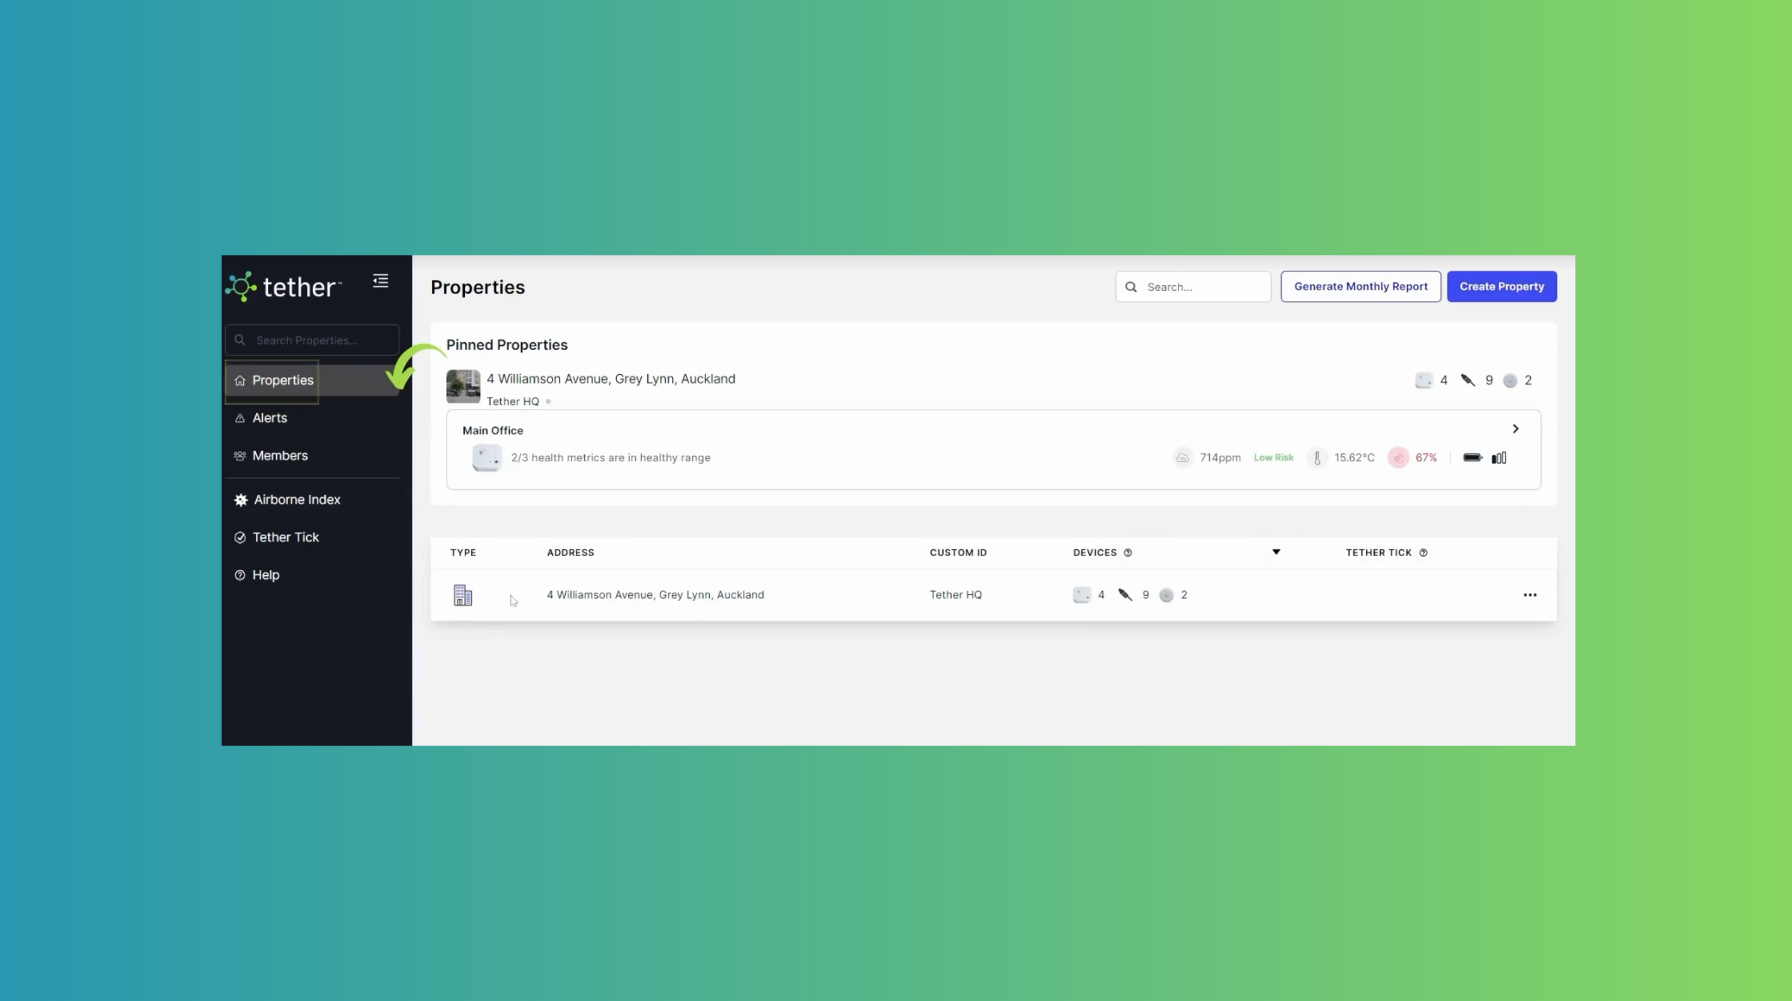
To access your reports, you first Select the property you wish to generate the report for
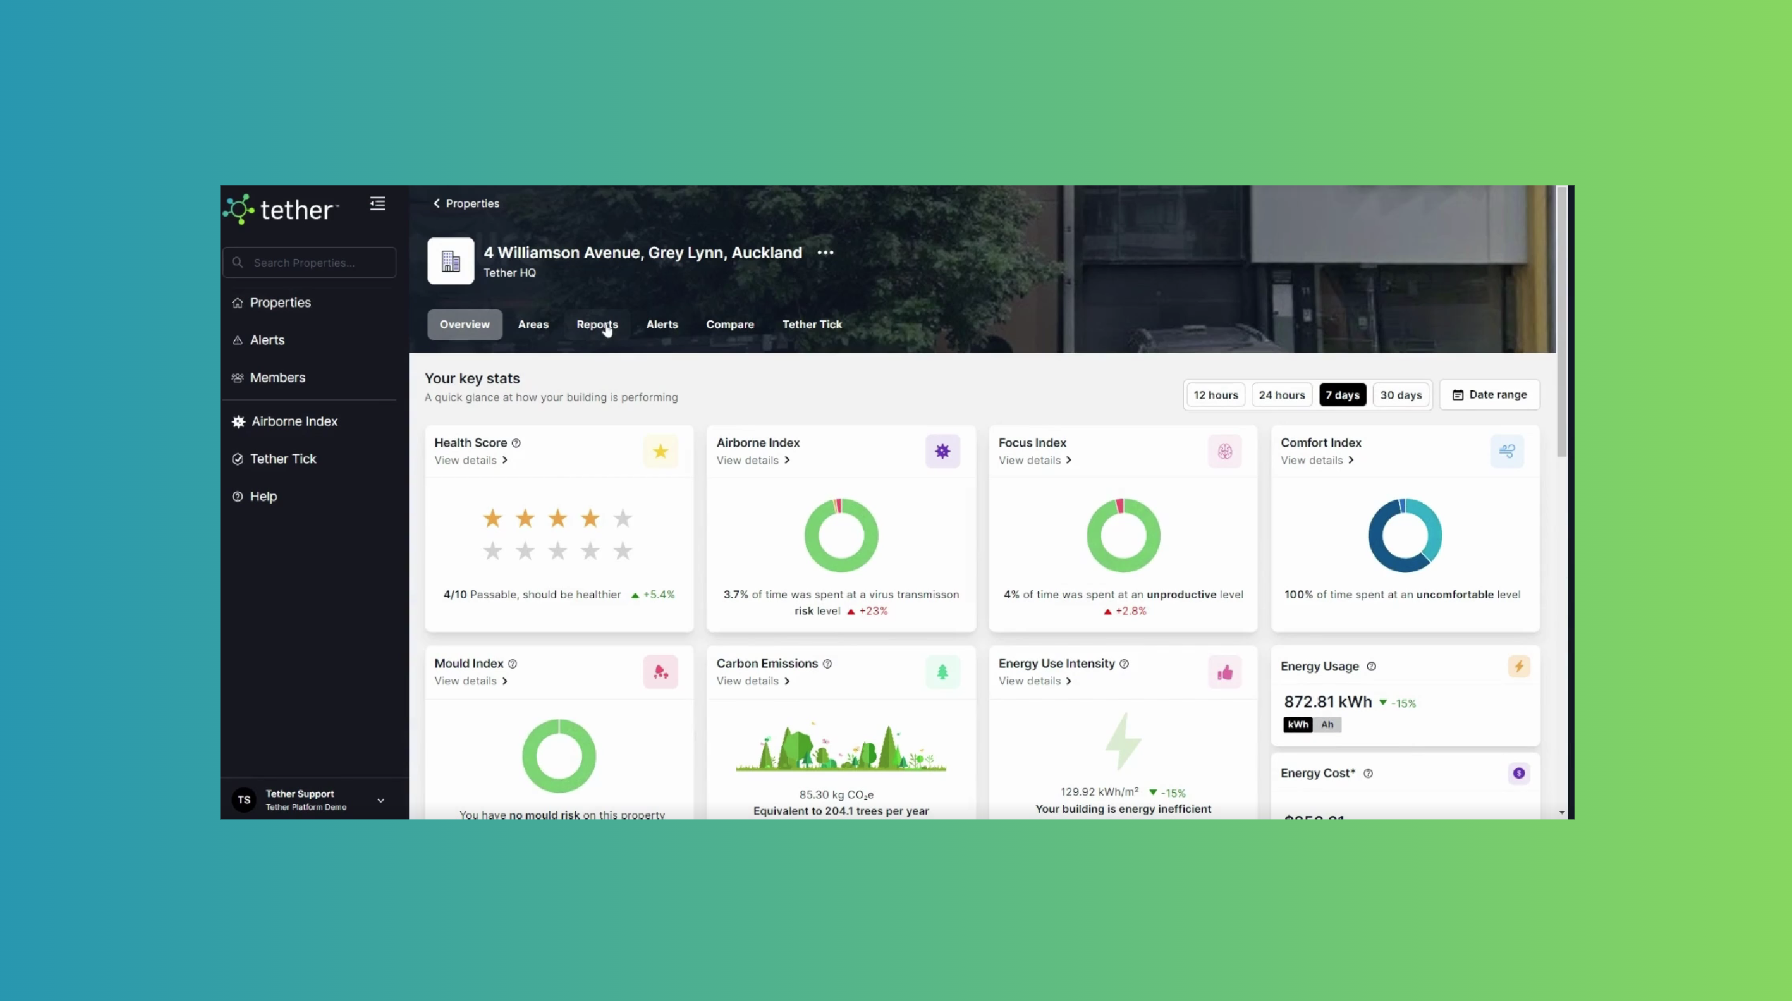
Once in your property, select the report tab
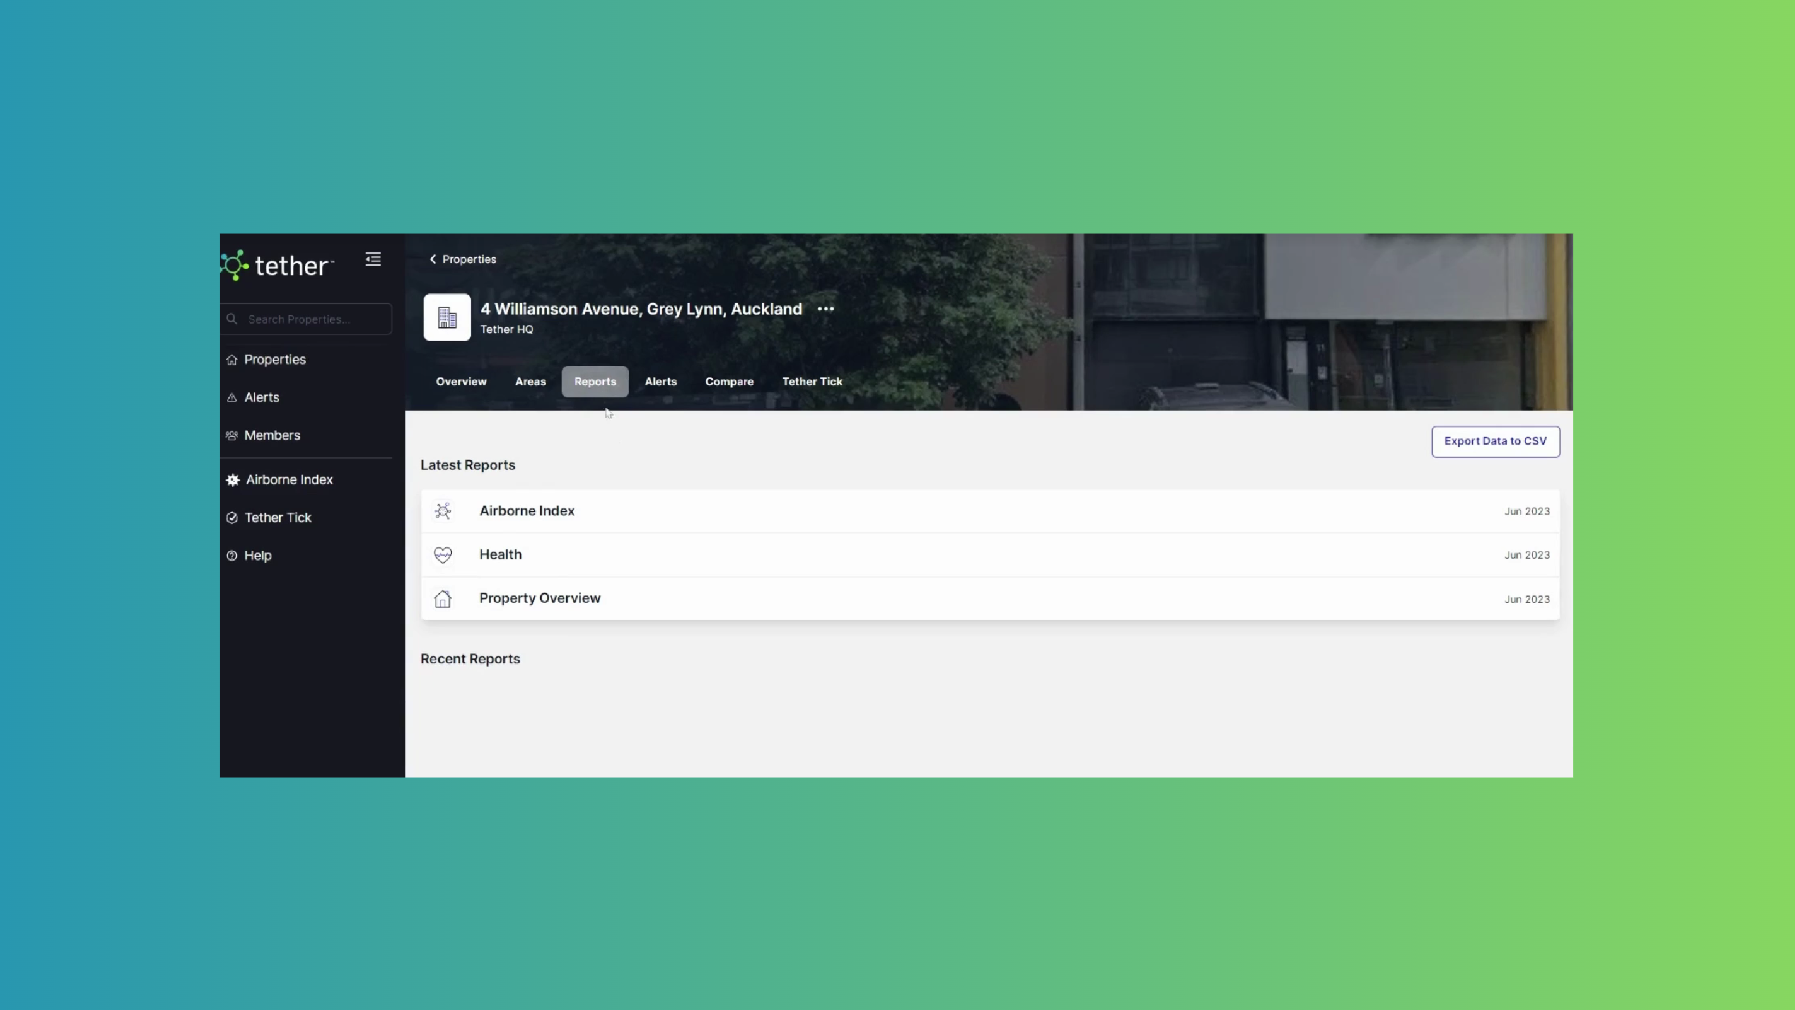
Your latest monthly reports appear at the top and All previous months reports are located under the recent reports. Reports are only available after the first months of data has been collected.
OK, so We have a few monthly reports to choose from.
Firstly, we have the Airborne Index. This is a summary of all your areas and how risky they have been for Airborne virus transmission that month (show example)
Next up we have the health report. This is a high level look at how areas are environmentally performing . Comparing time spent in the health vs unhealthy ranges (show example)
To download the Airborne and Health report, you can just click them and then they will download automatically. This can take a few minutes.
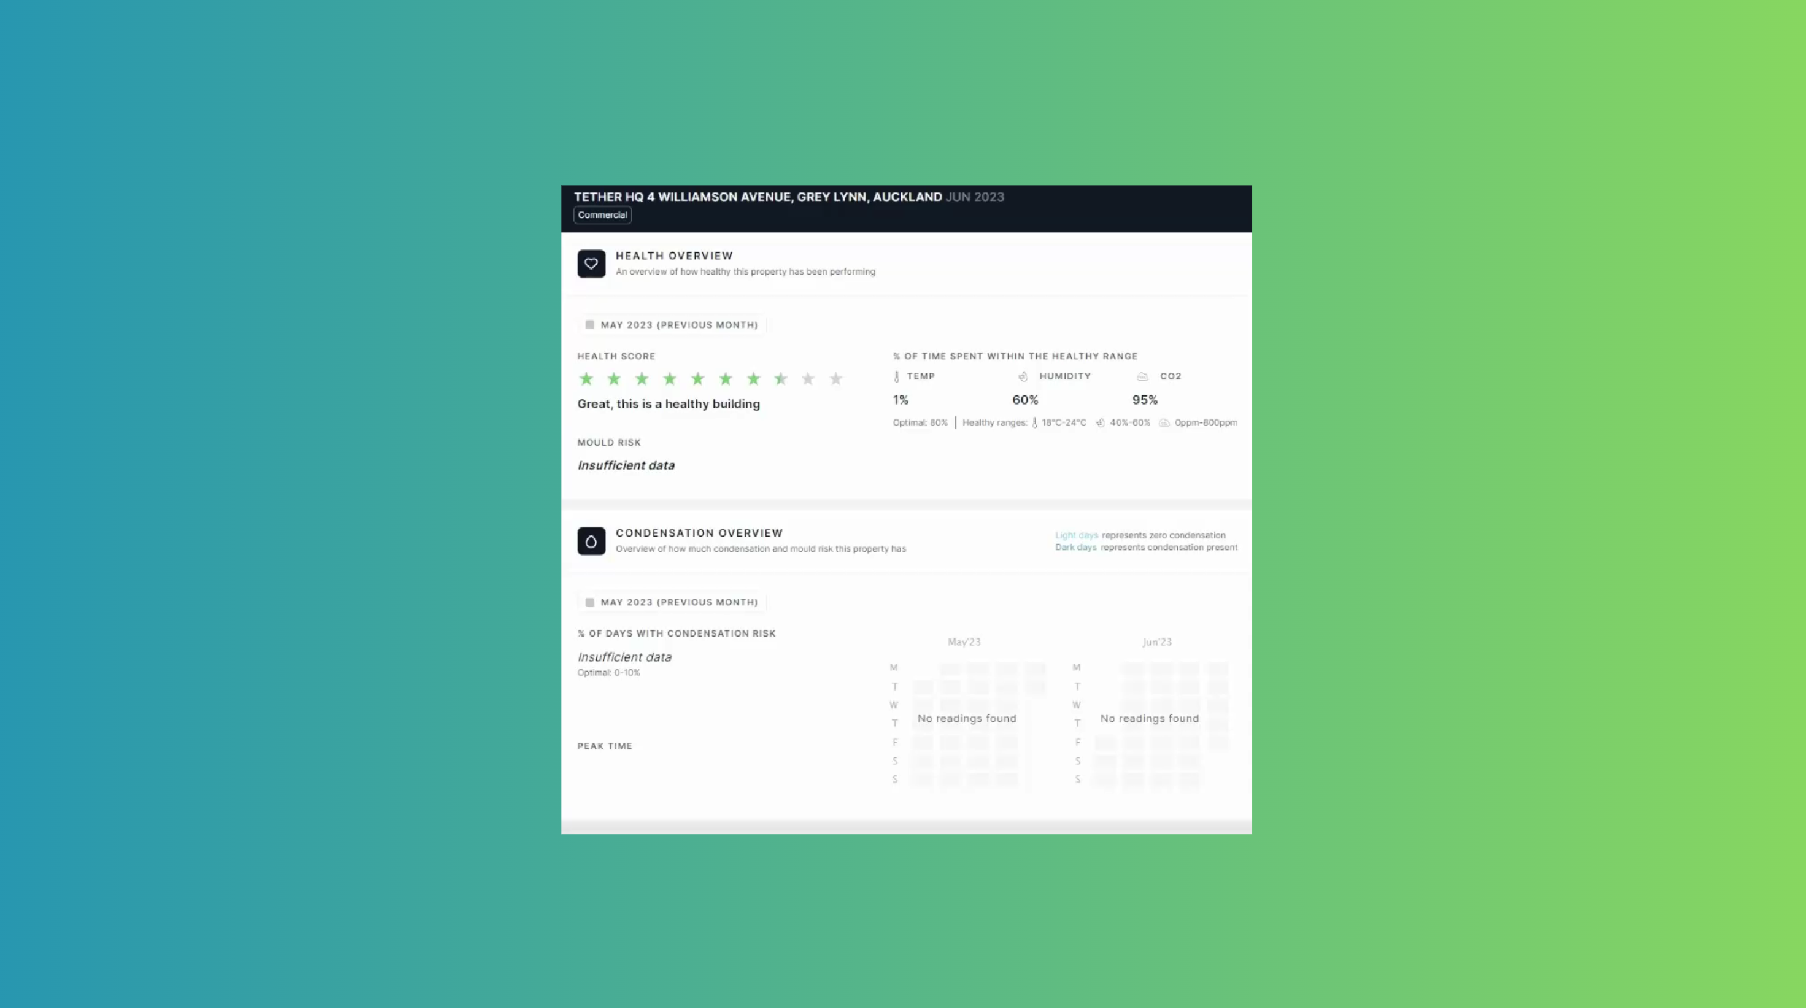
Lastly, we have our Property Overview Report. This is our most comprehensive report which shows you buildings performance of the last month and how it compared and changed to the previous month. This includes Environmental, energy, interventions, and condensation insights. To download the The Property Overview report , you click on the report and open it up, the may take a couple of a seconds to load as it’s a lot of data, then select print and the save PDF
Lastly, are you wanting only raw CSV data? You can grab all your environmental and energy data from the Performance tab.
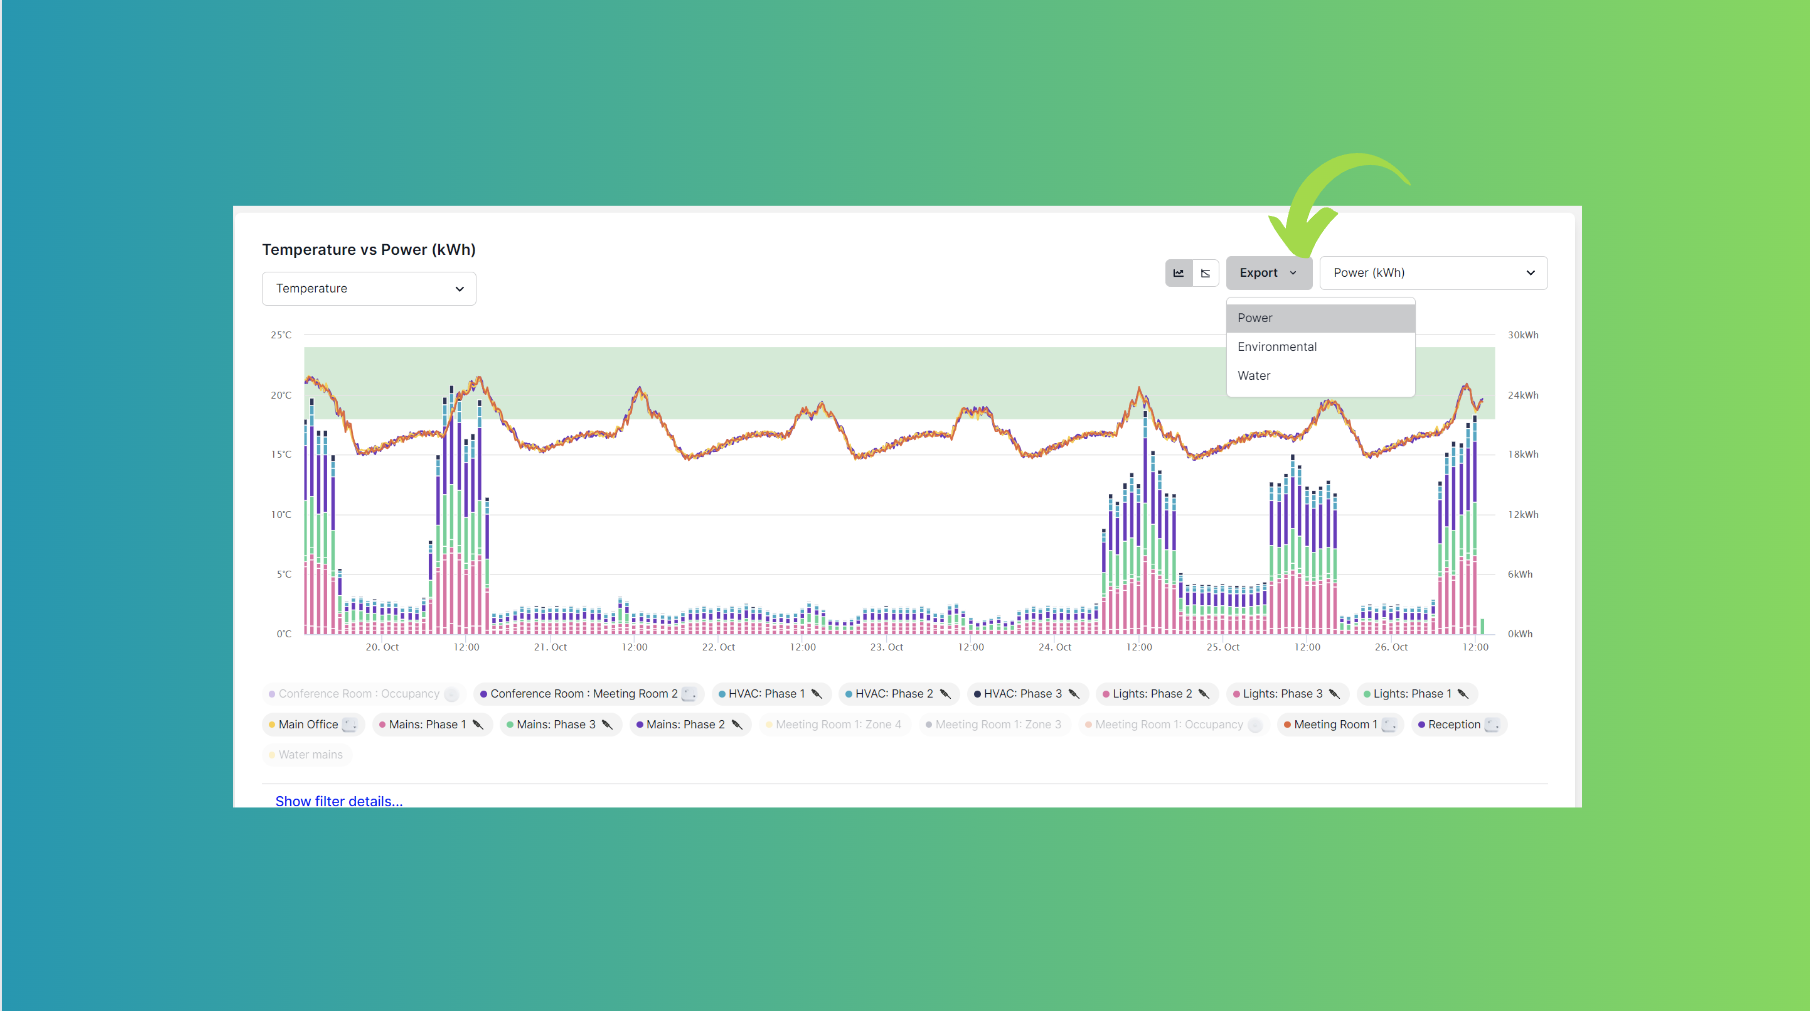
Firstly, select the date range in the top right. Use the calendar to select the date range you wish to export data for. From here, navigate back to the Performance tab and hit the export button. Select; Power for all your energy data, Environmental for all your Air Quality data, and Water for all your water consumption data.
Tapping each of these will generate an individual CSV file.
If you have questions you can also reach out to us on support@tether.co.n and our friendly team can help you.
![Tether Primary Logo-01-1.png]](https://partners.tetherhq.com/hs-fs/hubfs/Tether%20Primary%20Logo-01-1.png?height=50&name=Tether%20Primary%20Logo-01-1.png)